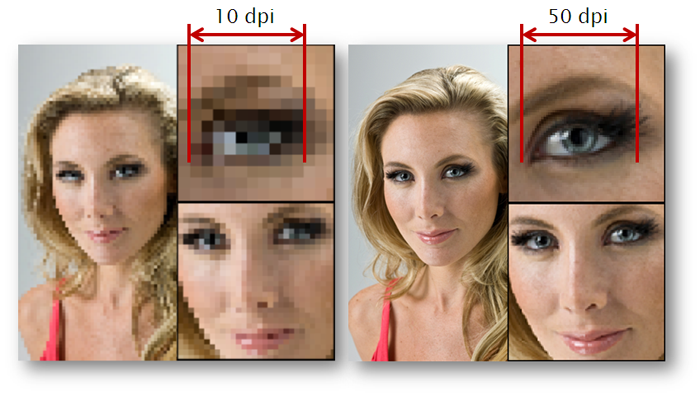
The Resolution of a camera system describes its ability to resolve detail in a scene. The diagrams below illustrate the improved detail quality of the image captured at 50 dots per inch (dpi).
Visual Evaluation:
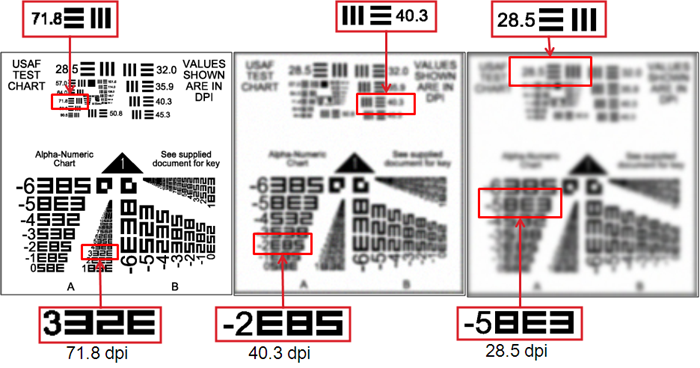
Traditionally, resolution has been evaluated visually using targets such as the USAF 1951 or Alpha-Numeric features as shown below.
Visual evaluation has a number of disadvantages, including:
- Requires trained evaluators
- Selection of “visible” level is subjective
- Selection varies depending on evaluators personal eyesight
- Repeatability problems for each evaluator
- Measurements are quantized
- Measurements need to be recorded manually
- Measurements don’t distinguish between sensor and optical components
Automatic Resolution Measurement:
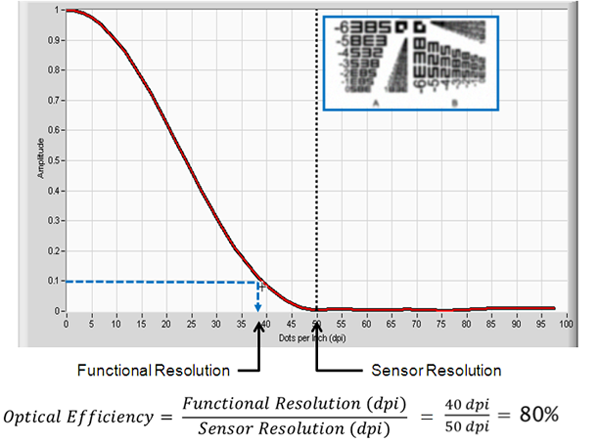
Imaging Gauge™ utilizes the “slanted-edge” technique described in ISO 12233 to allow computer-based evaluation of camera resolution. The program first calculates the Spatial Frequency Response (SFR) of the system, and then extracts the Functional Resolution based on a specified discernment limit. The SFR curve calculates the amount of detail, expressed by the spatial frequency that is captured by an imaging system. The amount of detail is expressed on the y-axis as a ratio of input to output amplitude of a signal. If detail is fully captured by the system for a given frequency, the SFR amplitude is 1. If no detail is captured (at very high frequencies), the SFR amplitude is zero.
There are two main factors of the resolution performance of a camera system: sensor resolution and the efficiency of the optical components. Sensor resolution provides the maximum possible resolution that can be achieved while the quality of the optical components determines how much of that potential is retained when an actual image is captured.
The chart below shows the effect of both factors. Lower sensor resolution results in fewer pixels defining the text in the image. In the chart, image sizes have been normalized to show the “pixelation” effect for low sensor resolutions. Lower optical efficiency results in less focused, “blurry” images. Each column in the chart indicates a constant sensor resolution. Both components ultimately have the effect of lowering the functional resolution of the system.


