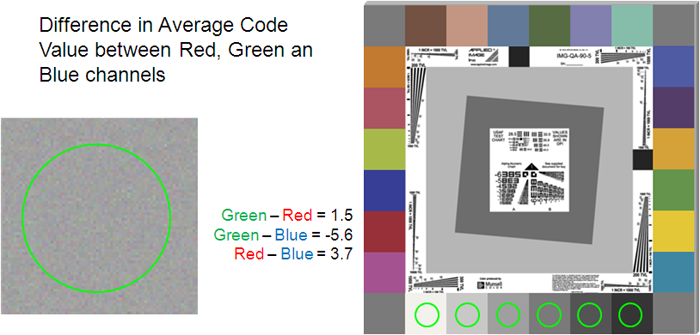
The average digital code values for the six (6) neutral patches are used to calculate color balance for these patches. Neutral color balance assesses the difference between the average values of the three color channels within each neutral patch. The difference between the average digital value for each of the three color planes is calculated as follows:
Examples:
The following example demonstrates how neutral balance is calculated for a single patch:
Average Red Digital Code Value = 205
Average Green Digital Code Value = 210
Average Blue Digital Code Value = 215
Neutral Balance Calculations:
Green – Red = 210 – 205 = 5
Green – Blue = 210 – 215 = -5
Red – Blue = 205 – 215 = -10
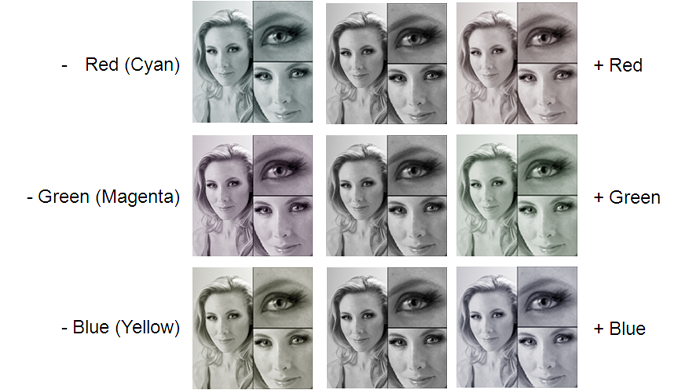
The diagram below demonstrates the visual appearance of the changes in the neutral balance:
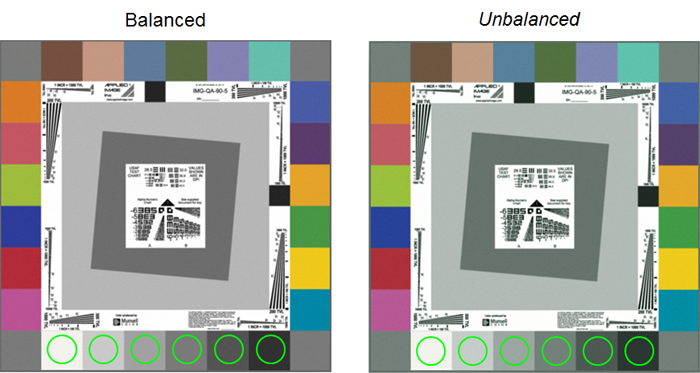
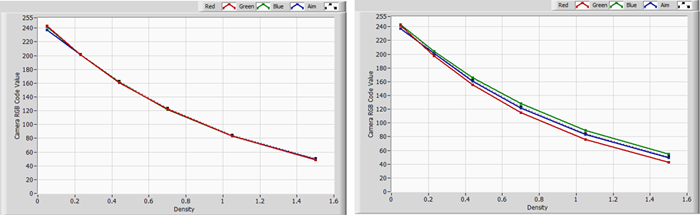
The Imaging Gauge system is used to quantify neutral balance using the six neutral patches. An example is shown below:
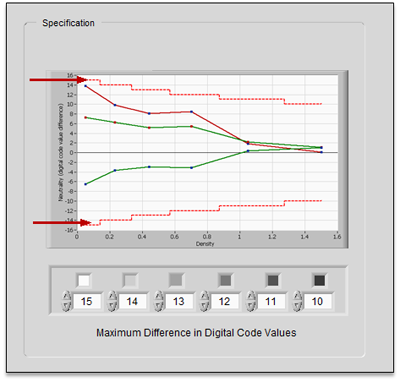
Average code values are shown below for each target. Note the separation of code vales for the darker patches. The red, green and blue tonescale lines on the unacceptable image follow the aim tonescale but diverge from each other at higher densities.
The difference from the Tonescale aim shows the separation clearly. The red, green and blue tonescale lines on the unacceptable image follow the aim tonescale but diverge from each other at higher densities. Note that the tonescale curves are within specification.
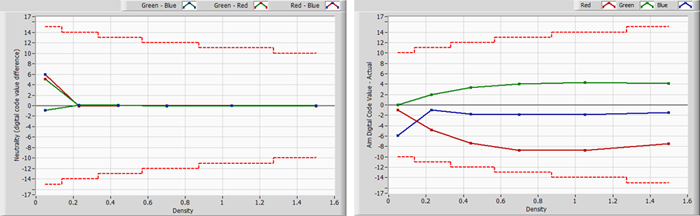
But the Green-Red values on the unacceptable image are outside of the neutral balance specification at higher densities.
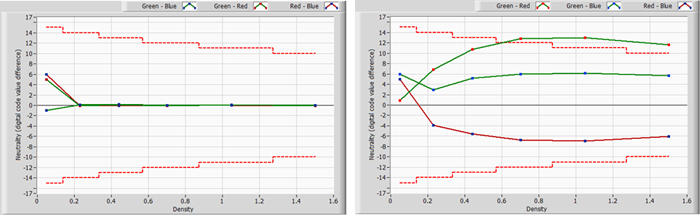
The three (3) color balance measurements are displayed with tolerance values around zero. Tolerance levels are not displayed when the Color Test Method is set to “Color Profiles” since this method only assesses color using the Delta E method. Since the neutral balance can be positive or negative the limits are added and subtracted from zero to set limits.